Quadratic Functions:   Graphing & Standard Form

Introduction:

These trinomials are unique functions that have many properties to explore.   A quadratic function is in standard form when written as \(f(x)=ax^2+bx+c\).   When graphed, the graph takes on the shape called a parabola, and the graph has many key features.   The following video will outline all those key features.


Example

parabolaKF

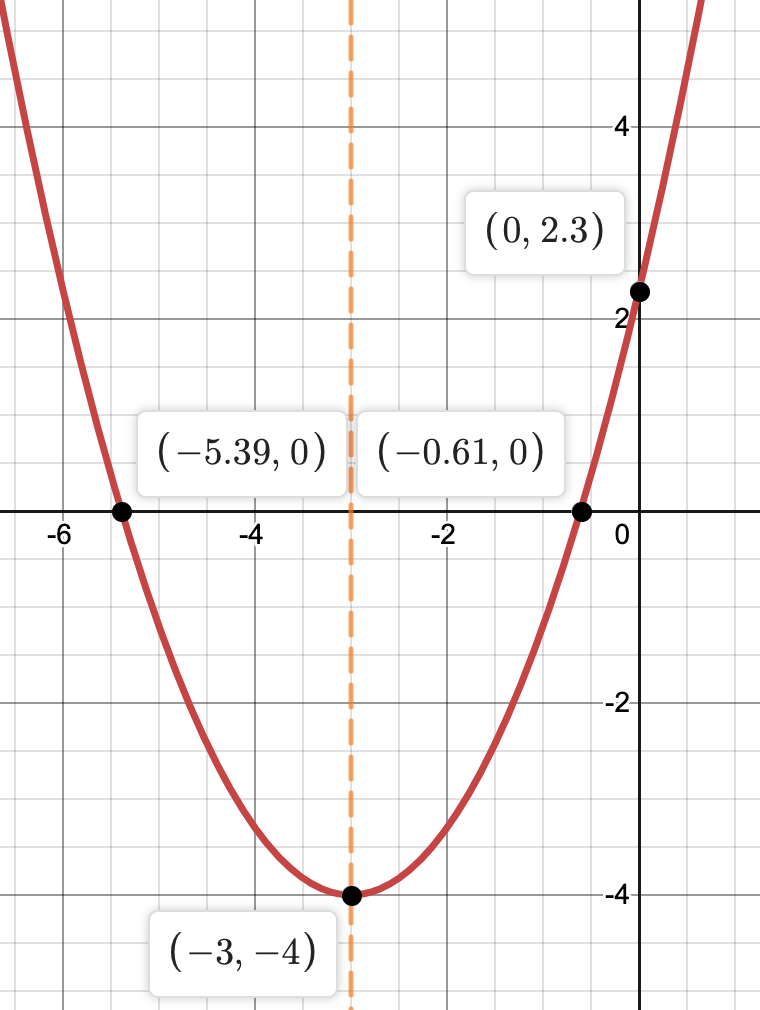
The graph on the right shows a parabola with key features identified as follows:

  1. the vertex at \((-3,-4)\)
  2. the \(y\)-intercept at \((0,2.3)\)
  3. two \(x\)-intercepts at \((-5.39,0)\) and \((-0.61,0)\)
  4. the axis of symmetry with equation \(x=-3\).
  5. the domain is all real numbers, or \((-\infty,\infty)\)
  6. the range is \([-4,\infty)\)
KEYS
  • Remember to always put \((0,\#)\) for \(y\)-intercepts
  • Remember to always put \((\#,0)\) for \(x\)-intercepts
  • The domain defines all the \(x\)-values allowed on the graph.   For parabolas, it will always be \((-\infty,\infty)\) unless restricted by a word problem.
  • The range defines all the \(y\)-values allowed on the graph.   The value of \(k\) from the vertex defines this:
    • \(a > 0\) parabola opens up, so range will be \([k,\infty)\)
    • \(a < 0\) parabola opens down, so range will be \((-\infty,k]\)


Graphing Parabolas

To get started, consider the basic function defined by \(f(x)=x^2\).   This function is written in standard form with \(a=1\) and both \(b=c=0\).   The following sequence shows a table created from the basic function, the points then plotted and finally the basic graph all together:

Table Points Basic Graph
basicTable basicGraphPoints basicGraph

The graph at the right has the basic graph \(\color{purple}{f(x)=x^2}\).   Note, the vertex in the basic graph is at \((0,0)\).

A small change to the function   \(\color{green}{f(x)=(x-h)^2}\)   translates the basic graph left or right depending on the value of \(h\).

The function given by   \(\color{orange}{f(x)=x^2+k}\)   translates the graph up or down depending on the value of \(k\).

Pay attention to how the vertex \((0,0)\) is changing as these graphs move.   The function shown in blue is defined by   \(\color{blue}{f(x)=(x-4)^2-5}\)   The vertex is located at the point \((4,-5)\), which means the basic graph has been translated to the right \(4\) units and down \(5\) units.

This leads to a new form of quadratic function called vertex form and will be discussed in the next topic.