Introduction:
Mr. Crawford is ordering pizzas and breadsticks for a school pizza party and has a budget of \($81\), but no more. An order of breadsticks costs \($7\), and a pepperoni pizza cost \($13\).
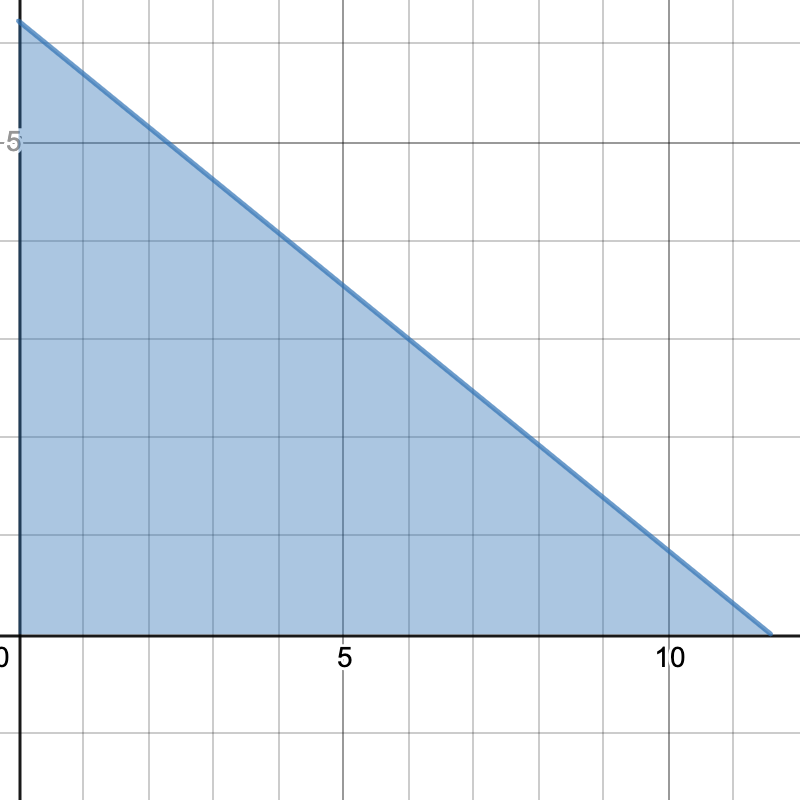
The budget causes a constraint that needs to be considered. The phrase "no more" means Mr. Crawford can spend \($81\) or less. This leads to an inequality. Let \(x\) denote the number of orders of breadsticks and \(y\) be the number of pepperoni pizzas. Then the inequality looks like: \(7x+13y\le81\).
One possible combination is \(2\) orders of breadsticks and \(4\) pepperoni pizzas:
\(\implies7(2)+13(4)=14+52\implies66\le81\) TRUE.
Another combination is \(4\) orders of breadsticks and \(3\) pepperoni pizzas:
\(\implies7(4)+13(3)=28+39\implies67\le81\) TRUE.
The combination of \(6\) orders of breadsticks and \(3\) pepperoni pizzas gives exactly \($81\):
\(\implies7(6)+13(3)=42+39\implies81\le81\) TRUE.
However, the combination of \(6\) orders of breadsticks and \(5\) pepperoni pizzas does NOT work:
\(\implies7(6)+13(5)=42+65\implies107\nleq81\) FALSE.
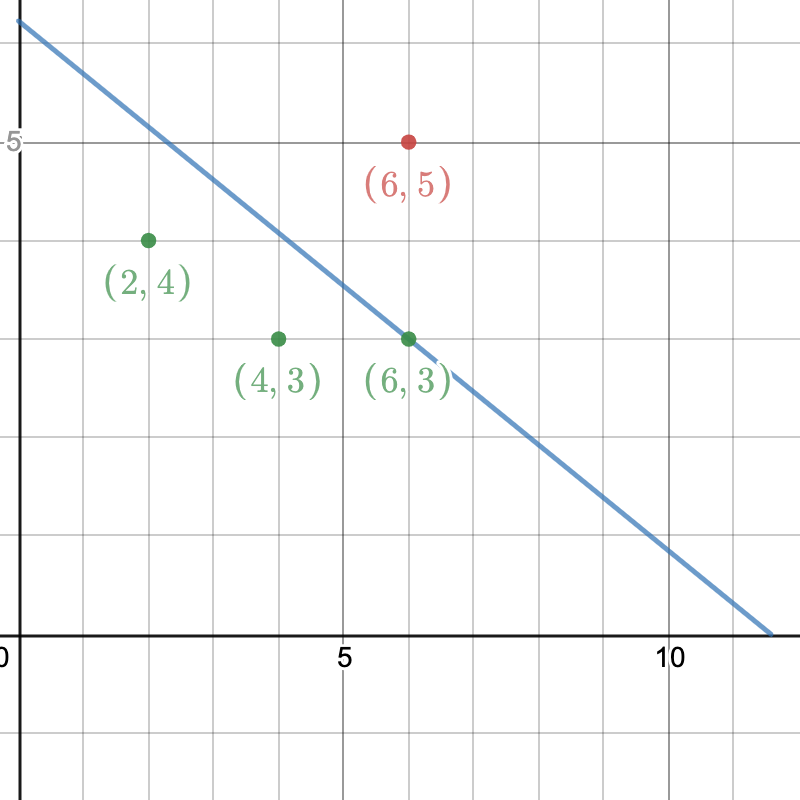
The graph shows the line \(7x+13y=81\), and the combinations that gave TRUE are either ON or BELOW the line. The combination that gave FALSE is ABOVE the line. So how can ALL possible combinations be found? There are two things to consider to find all possible solutions:
- Are points ON the line solutions?
- Are the points ABOVE or BELOW the line solutions?